Data Analysis and Reporting in Time Cockpit
Time cockpit contains different functionalities to analyze your time-tracking data:
- You can use time cockpit’s list engine to explore data in a highly customizable grid. It supports interactive filtering, sorting, grouping including subtotals and totals, hyperlinks to other lists, etc.
- If you prefer Excel, you can export lists into an Excel file and use e.g. Pivot Tables to create reports and charts.
- Some of customers have implemented Data Warehouses where they integrate data from different sources including time cockpit. They use specialized data analysis and reporting tools with it.
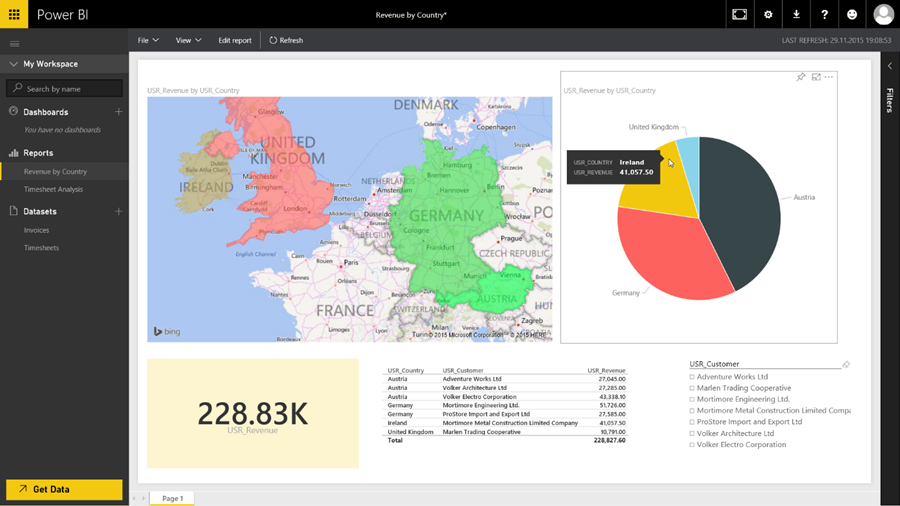
Power BI
In the last months, Microsoft has strongly invested in a SaaS tool for self-service data analysis called Power BI. It contains a full client for data analysis professionals as well as a web client that end users can use to create interactive reports and dashboards.
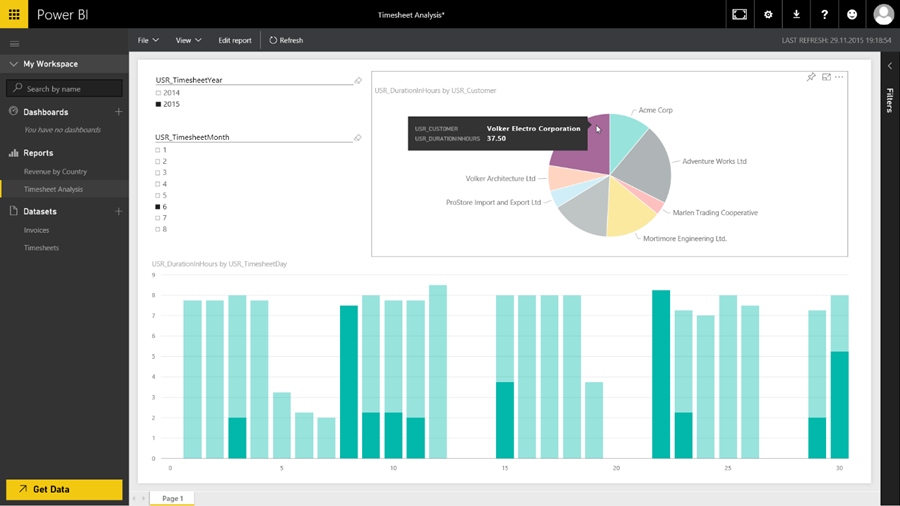
Power BI’s web client is integrated in Microsoft’s Office 365 offering. All you need to use it is a browser. Therefore, it is platform-independent.
To start, you can make use of Power BI’s free pricing tier. Compared to the professional edition, it is a bit limited in terms of functionality and storage. However, it is a great option to get started and evaluate whether Power BI provides value for you.
Integrating Time Cockpit Power BI
You have two options how to use Power BI together with time cockpit:
- Time cockpit offers an OData-compliant web service layer. Power BI’s full client can handle OData. Therefore, you can access time cockpit live using this protocol. We have written about this option in the past.
- If you want to use Power BI’s web client, you need to export your time cockpit data into a Power BI Dataset. This gives you great performance as Power BI can optimize the data for online analysis (OLAP) and not – like time cockpit has to – for supporting operational business processes (OLTP).
For option two, some of our customers have used time cockpit’s Excel exporter in the past. So they had to perform multiple manual steps to get data from one system into the other. This process can be automated as time cockpit and Power BI offer web services. All you need is a small script that reads data from time cockpit’s web services and writes it using Power BI’s web services. For this month’s newsletter we created a sample demonstrating how this could work.
Video
The following video contains a walk-through for how to get and use the sample:
Source Code
You can find the source code of our sample on Github.
In the video above you see that you need just a single method call to transfer the result of one time cockpit query to Power BI. Take a look at app.ts to see how it works.
If you are a programmer and you are interested in the details, look into importer.ts. Feel free to adopt it to your specific needs. If you find bugs or make extensions that might be useful for other users, you can also send us pull requests.
If you just want to use Power BI and do not want to deal with source code, contact us. Our time cockpit consultants would be happy to assist you integrating time cockpit with Power BI.
Here are some additional resources for developers who want to learn more about programming Power BI:
Prerequisites
To get, build, and use the sample, you need the following prerequisites (there is a free option for all of them):
- Install the latest version of Node.js on your computer.
- Install the latest version of Git on your computer. As an alternative you could use a graphical Git client like Visual Studio, Source Tree, Github Desktop, etc.
- To automate the data exchange, you will need a subscription of Microsoft Azure.
Building and Using the Sample
The process of how to use the sample is described in details in the video above. Here is a short summary:
- Clone the sample repository from Github.
- Open a command or terminal window and navigate to the directory into which you cloned the repository.
- Load the necessary Node.js packages using the command npm install
- Load the necessary TypeScript Definitions using the command tsd reinstall --save (if this is the first time you use tsd, you first have to install it using the command npm install -g tsd)
- Now you can compile the TypeScript code into JavaScript using the command node node_modules\typescript\bin\tsc
- Rename run-sample.cmd to run.cmd
- Open run.cmd in an editor and fill in the necessary data (e.g. credentials to access Power BI and time cockpit, application information from Azure Active Directory; for details see video above).
- Run the script run.cmd. After that, your time cockpit data should be in Power BI.
We hope this sample enables you to build great dashboards for your time cockpit database.
comments powered by